Lesson 7 of 11 · Using the Spreadsheet
Work in Progress and Age Chart
Read daily work in progress by age band and configure warnings for sudden changes.
Lesson notes
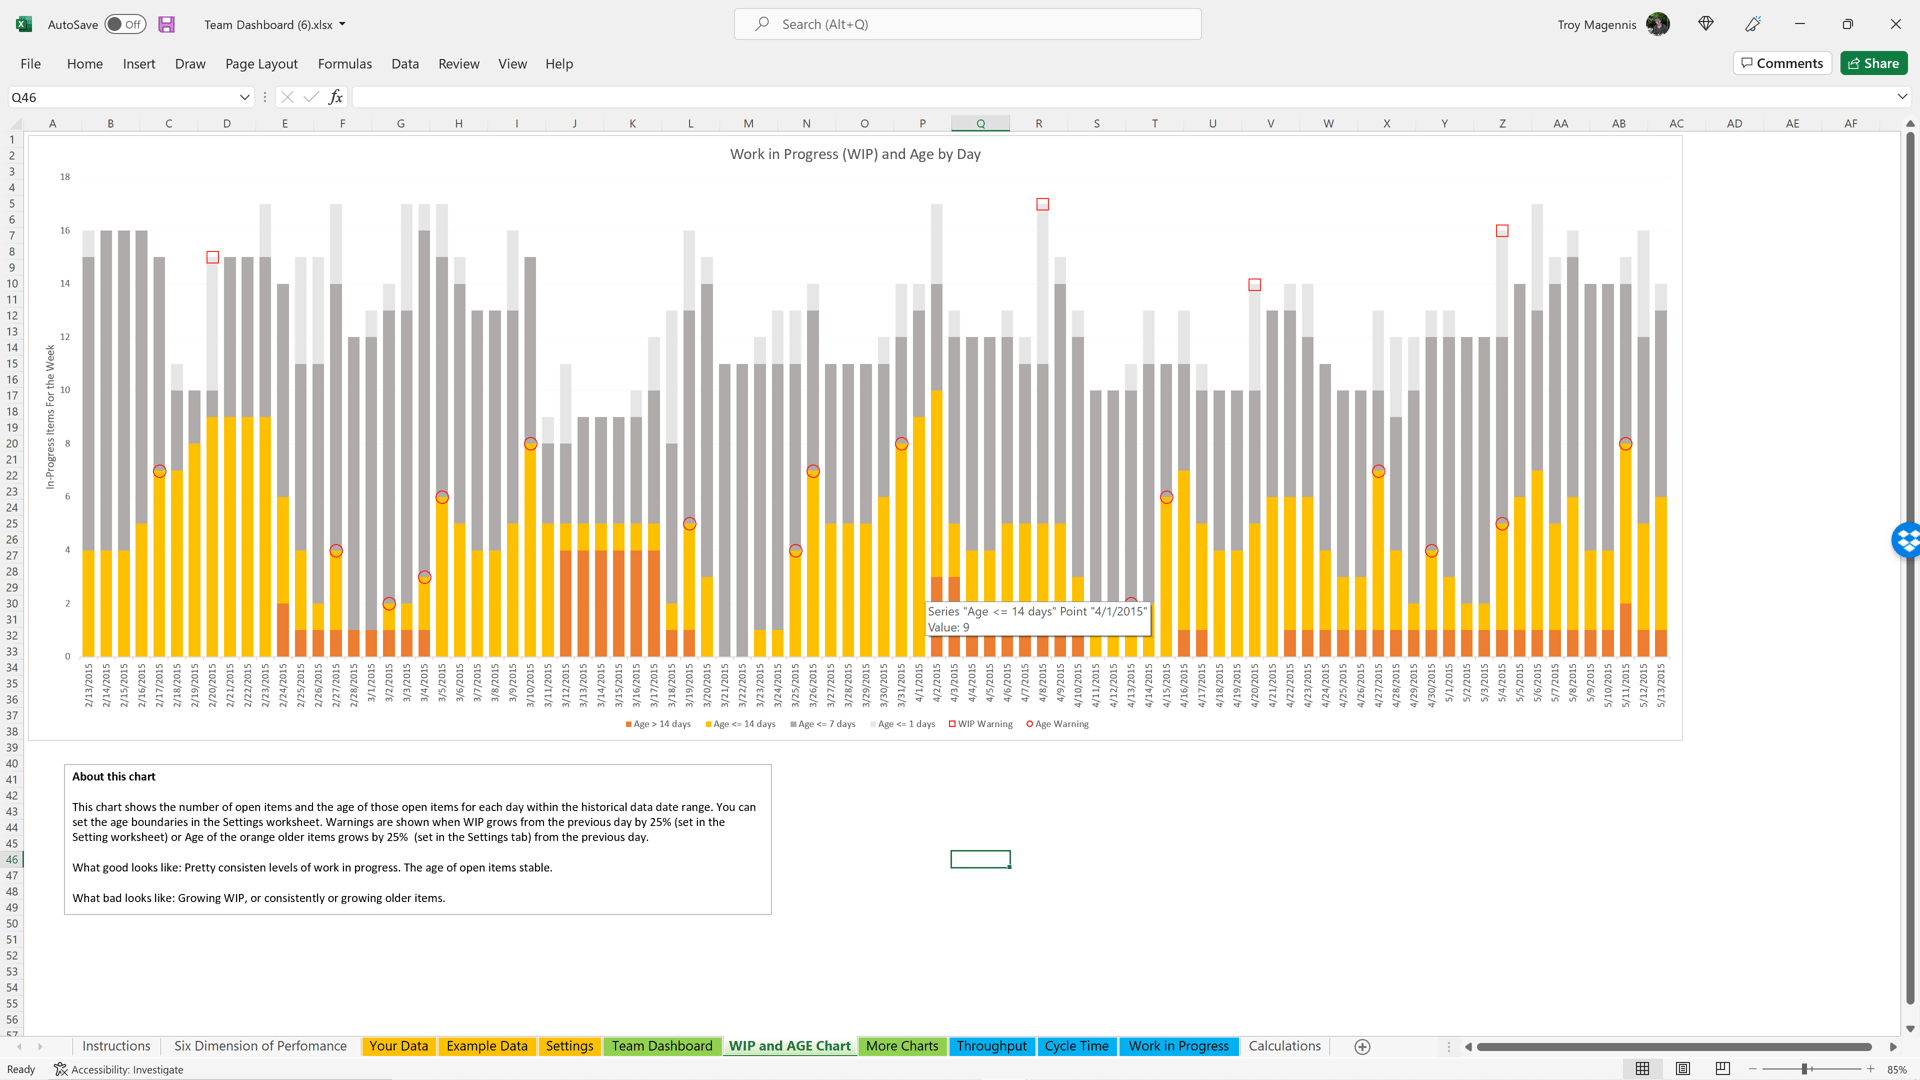
The chart shows work that has started but is not complete, day by day, color-coded by age.
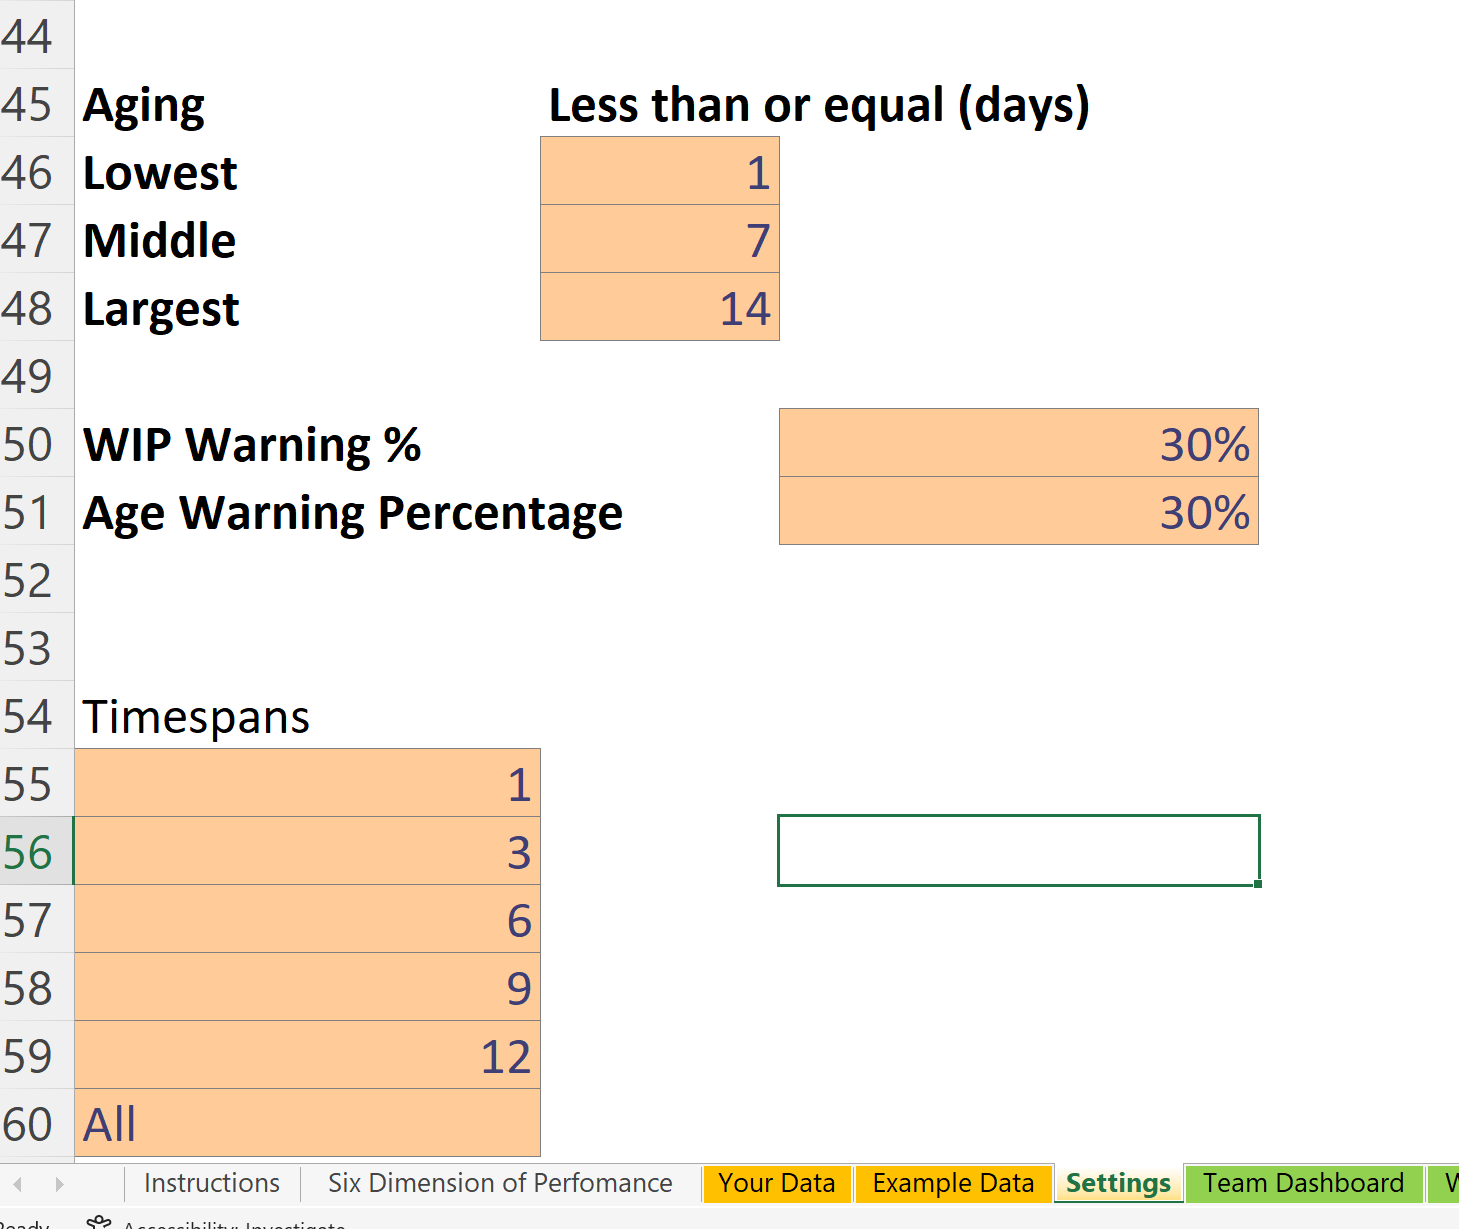
- Lowest, Middle, and Largest set the age-band thresholds. For example, 1, 7, and 14 days create light gray, dark gray, yellow, and orange bands.
- WIP Warning % marks a large day-over-day change with a red square above the WIP column.
- Age Warning % marks a large increase in older yellow and orange items with a red circle.