Lesson 6 of 11 · Using the Spreadsheet
Team Dashboard and the Six Dimensions of Performance
Understand the dashboard’s balanced performance model and configure the view for your team.
Lesson notes
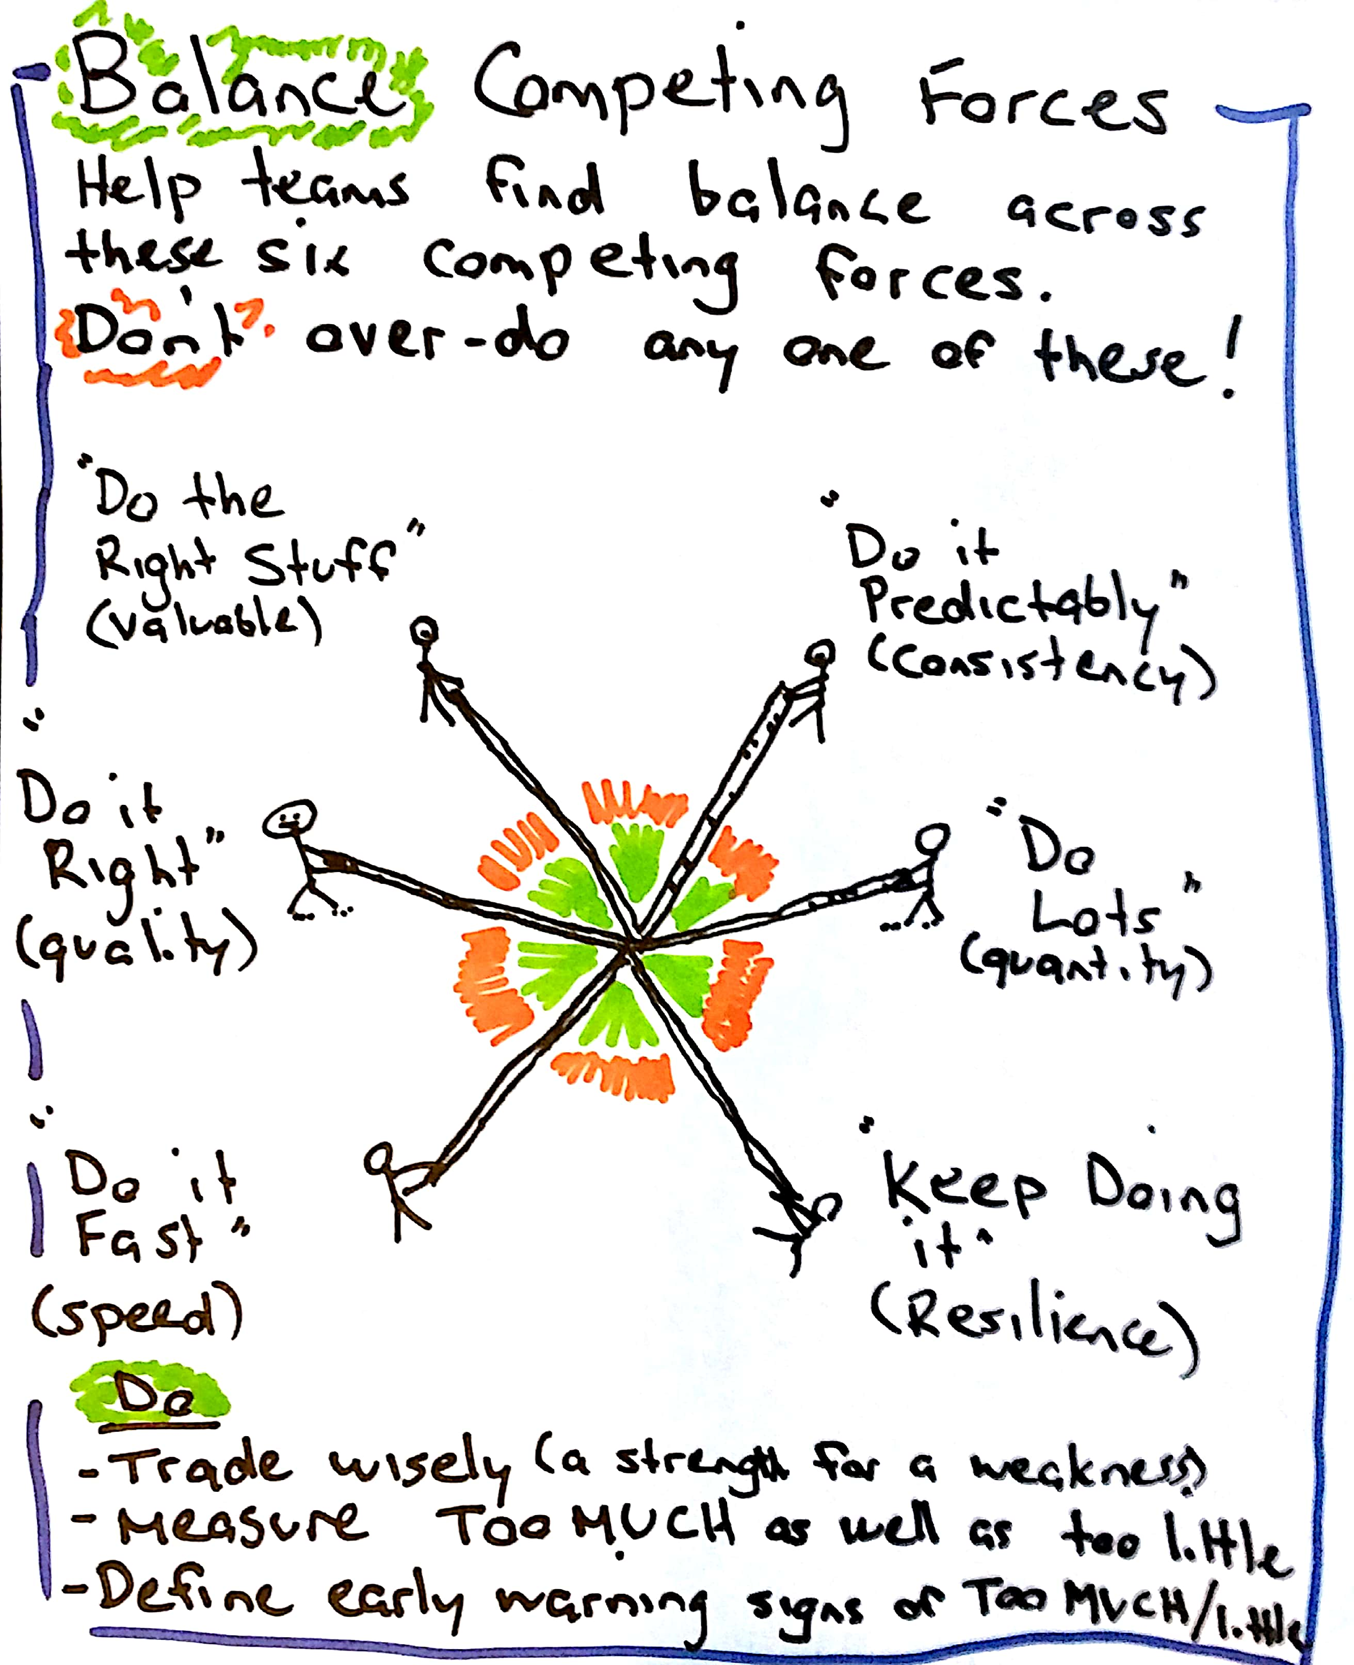
The Team Dashboard worksheet is based on the Six Dimensions of Performance model, extending the original four dimensions in the Software Development Performance Index by Larry Maccherone.
- The dashboard supports four of the six dimensions and includes one selected chart from Other Charts; replace charts with your own when useful.
- Set the team name on the Settings worksheet.
- Use the controls to choose your data, filter by work type, and set the date range.
- The default three-month view helps workbook performance and keeps old data from stretching the date axis.
- Invent measures for Value and Sustainability that fit your team’s context.